Module 10: Varying Multivariate Regression
Hi everyone!
This week we dive into a more complex regression analysis than the linear regression we have done. Before we had one predictor variable and one outcome variable. In multivariate multiple regression, we have multiple predictor(or independent) variable but one outcome variables we are analyzing. The formula looks like y = b1x1 + b2x2 + … + bnxn + error.
We will look into the relationships between the variables collectively using ANOVA analysis and individually through linear regression (lm) to understand which variables are contributing to the significance of the relationship. R sqaured will be an important factor to look into because it shows the amount of variation in dependent variable explained by the regression, thus a larger R squared indicates the predictor is more precisely able to predict outcome.
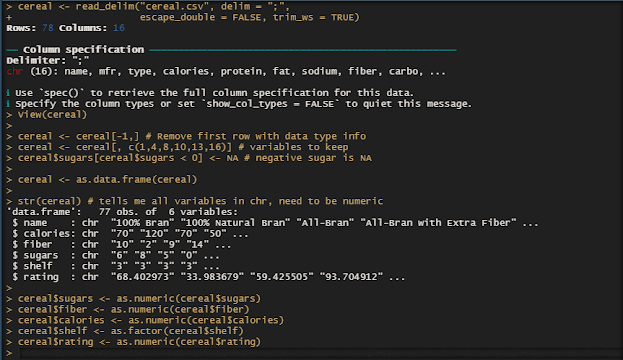
9.1. Conduct ANOVA (analysis of variance) and Regression coefficients to the data from cystfibr (> data (" cystfibr ") database. You can choose any variable you like. in your report, you need to state the result of Coefficients (intercept) to any variables you like both under ANOVA and multivariate analysis. I am specifically looking at your interpretation of R results.

Now, I am going to do an anova testing method called Backward elimination.
Step 1: Look at whole model, find predictor values with p value > 0.05 (Weight, bmp).


Age is the predictor variable that has the most significant effect on pemax, based on my anova analysis.
9.2 The secher data (> data("secher") are best analyzed after log-transforming birth weight as well as the abdominal and biparietal diameters. Fit a prediction weight as well as abdominal and biparietal diameters. For a prediction equation for birth weight. How much is gained by using both diameters in a prediction equation? The sum of the two regression coefficients is almost identical and equal to 3.
Can this be given a nice interpretation to our analysis?
Can this be given a nice interpretation to our analysis?

Here we look at the relationship between abdominal diameter and birthweight. There is significant relationship, and adjusted R squared is 79.4%.

There is significant relationship between biparietal diameter and birthweight, and adjusted r squared is 71.94%.

Both diameters yield an adjusted R-squared of 85.56% which is higher than either individual diameters relationship with the birthweight outcome.
A prediction weight equation for birthweight : pred_weight = -5.8615 + 1.4667(x) + 1.5519(x)
This multivariate regression equation gives a little higher predicted weight than the predicted weight by ad and a little lower than the predicted weight by only bpd. in individual linear regressions with birthweight.
A nice interpretation of the sum of regression coefficients being about 3 is as abdominal and biparietal diameters increase by 1, the predicted weight increases by about 3. This tells us the effect of both diameters is more or less the same on the outcome variable birthweight when working together as independent variables predicting birthweight.
-Ramya's POV

Comments
Post a Comment