Module 3: Describing descriptive statistics (Set 1 vs Set 2)
Hi everyone!
This week we are applying our knowledge of descriptive statistics into R functions. Two sets of data have been given which can easily be made into vectors in R. The first set of data is called "set1" and the second set of data is called "set2."
Descriptive statistics describes a data set through central tendency measures (mean, median, mode) and variance measures (range, quartiles, standard deviation, variance). Instead of doing this by hand, R has functions to make this process easier!
I have created two lists, which are basically cooler vectors that can have more than one data type, to showcase all the measures for each data set. I have also utilized the names function to make it easier to make comparisons of each measure from the sets.
Here is the code
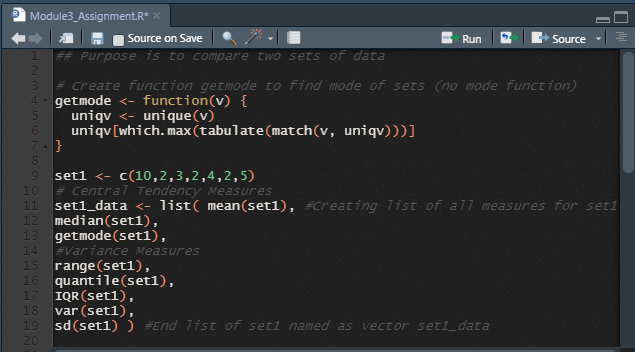


....(drumroll) The Output!
Set 1 Set 2


So, what do we see?
The main difference between both sets is set 2 is 10 more than set 1's data values. Due to all the elements of both sets being exactly 10 higher and the having the same number of elements, all central tendency measures for set 2 like mean, median, and mode are just 10 more than set 1's measures. This makes sense since these measures only take into account the number of elements (which is 7 in both) and the center which is just further right on the x axis. The variance measures are exactly the same, except for range which is 10 down the x axis, for both sets meaning the distribution is the same for both.
Take away!
We can learn variance measures are not sensitive to simply adding or subtracting the same value from data sets like central tendency measures are.
-Ramya's POV


Comments
Post a Comment